Strategy for binary options, Forex and CFD - Volatility Stretch indicator and Damiani Volameter v. 3.2
Strategy for binary options, Forex and CFD - Volatility Stretch indicator and Damiani Volameter v. 3.2
Strategy for binary options, Forex and CFD - Volatility Stretch indicator and Damiani Volameter v. 3.2is a volatility strategy for a 30-minute chart that allows you to determine the best moment to buy a CALL and PUT option.
Contents
- Minimum Time Frame and expiration time
- Recommended Time Frame and Expiration Time
- Strategy indicators Volatility Stretch indicator and Damiani Volameter v. 3.2
- Risk management
- Strategy Volatility Stretch indicator and Damiani Volameter v. 3.2: signal to increase
- Strategy Volatility Stretch indicator and Damiani Volameter v. 3.2: down signal
- Download strategy Volatility Stretch indicator and Damiani Volameter v. 3.2
......
Minimum Time Frame and expiration time
- Time Frame: M30
- Expiration time: 60 minutes (2 candles)
Recommended Time Frame and Expiration Time
- Time Frame: M30
- Expiration time: 90 minutes (3 candles)
......
Strategy indicators Volatility Stretch indicator and Damiani Volameter v. 3.2
- Damiani_volatmeter v3.2
- goldminer2
- Nina_StepMA_1_Custom3
- Pivots_Daily
- Stretch
Risk management
Trade is carried out with a fixed amount not exceeding 5% of the trade balance. You should not trade during the release of important economic news.
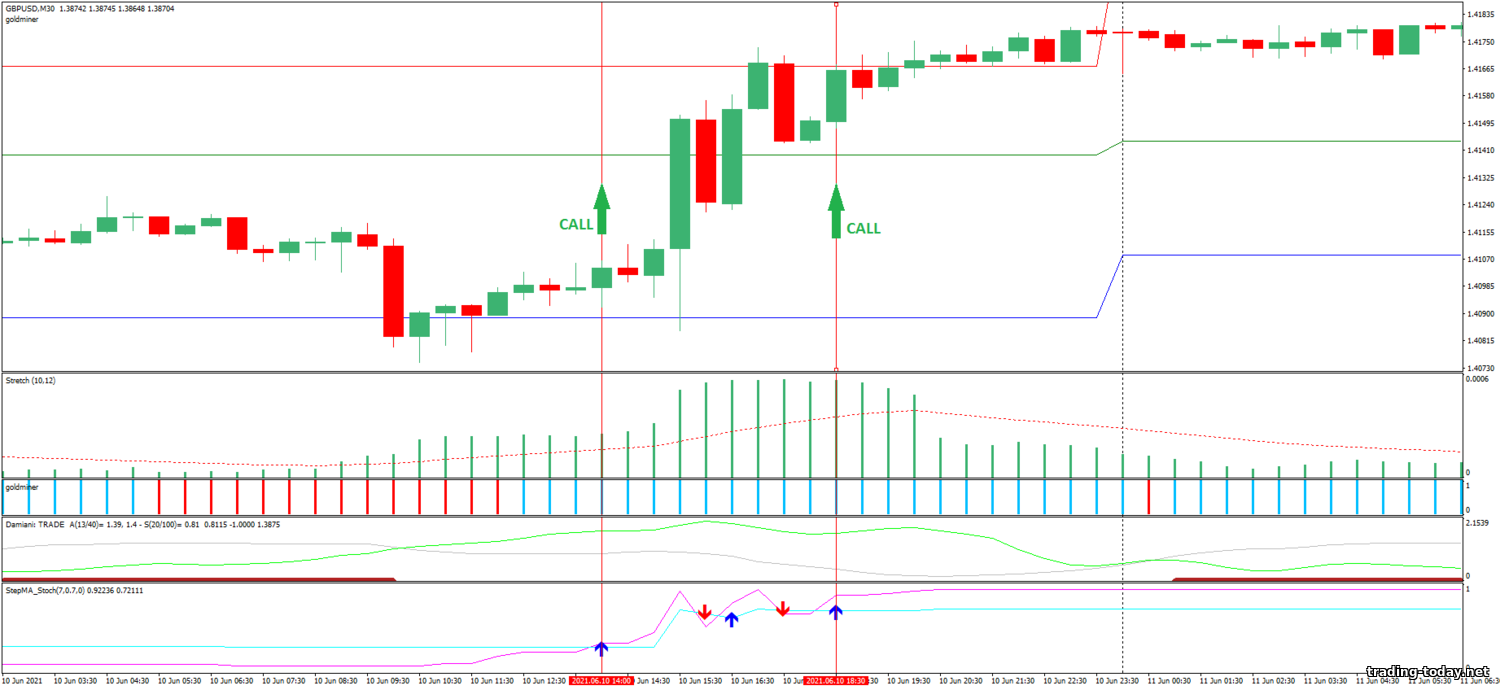
Strategy Volatility Stretch indicator and Damiani Volameter v. 3.2: signal to increase
- A blue up arrow appears in the lowest indicator
- On the Damiani indicator the green line is above the gray line
- Goldminer turquoise column
- Green Stretch bar above the dotted line
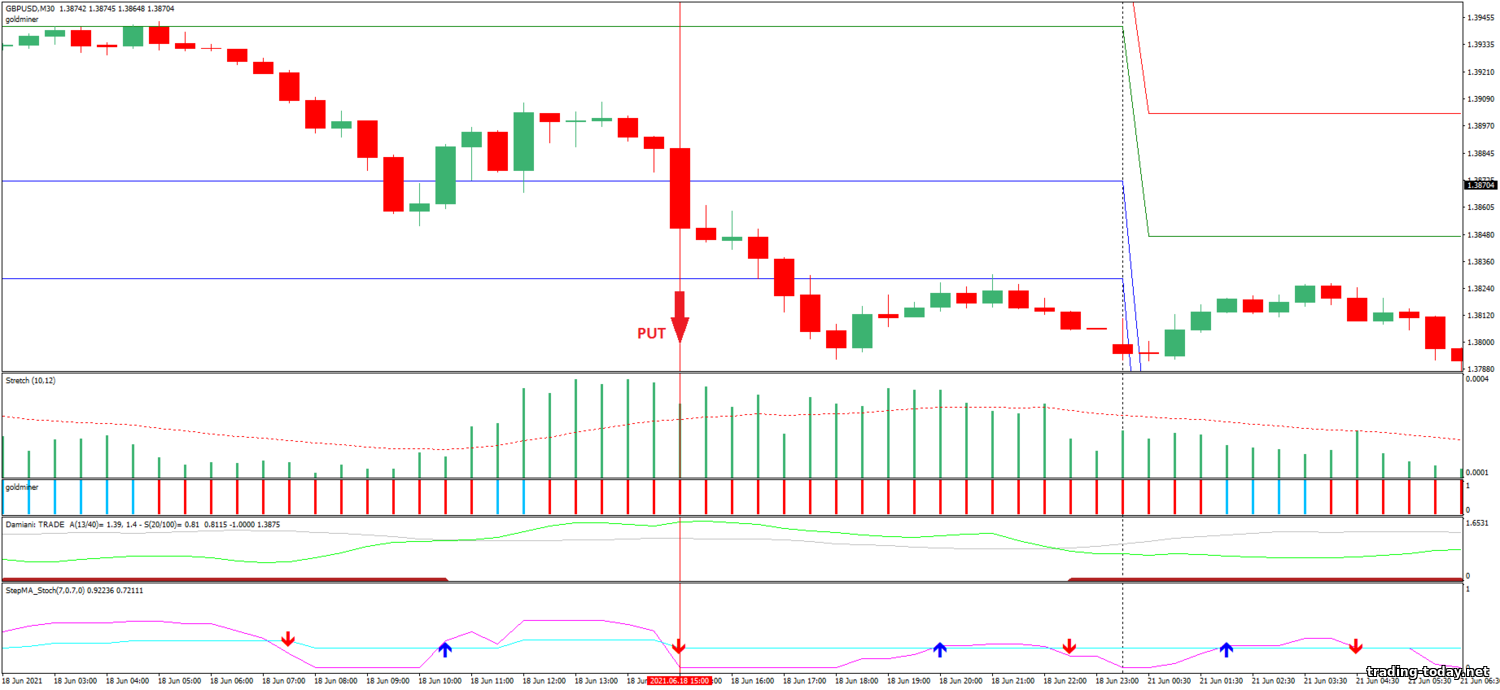
Strategy Volatility Stretch indicator and Damiani Volameter v. 3.2: down signal
- A red down arrow appears in the lowest indicator
- On the Damiani indicator the green line is above the gray line
- Goldminer column red
- Green Stretch bar above the dotted line
......
Trading on Forex and CFD
- Before starting trading, it is recommended to test the strategy on a demo account (open at least 3-5 trades)
- The trade is opened after receiving a signal from the trading strategy
- The ratio of Take Profit to Stop Loss should be 3:1 (for one unit of possible loss there should be 3 units of potential profit)
- The time frame of trading is not important - minute charts are suitable for scalping, hourly or daily charts are suitable for long-term trading
- Take Profit to Stop Loss levels are set depending on the selected time frame
- The strategy will show false signals on minute charts during the release of important economic news - trade on higher time frames or choose a different time for trading
......
Download strategy Volatility Stretch indicator and Damiani Volameter v. 3.2
Download strategy Volatility Stretch indicator and Damiani Volameter v. 3.2......


Reviews and comments